
 Luke WassandGitHub
4c48fe0c41
Luke WassandGitHub
4c48fe0c41
Intel GPUs (intel_gpu_top) never report temperature or memory, so the
"suspended card" heuristic in calculateGPUAverage (temp == 0 &&
memoryUsed == 0) fired on every collection that landed between samples.

intel_gpu_top samples every 3.3s (intelGpuStatsInterval) while the hub's
realtime worker collects every 1s, so most realtime collections had no
new sample (delta count 0) and returned an empty GPUData with power
omitted (json "p"/"pp" are omitempty). The frontend derives the GPU
Power Draw series and legend from the latest sample, so the chart and
legend blanked on roughly two of every three or four one-second cycles.

NVIDIA/AMD were unaffected because they report temperature even when
idle, so the heuristic never fired and the last average was already
carried forward.

Gate the zero-return on non-engine (discrete) GPUs so Intel GPUs carry
the last average forward during between-sample gaps, matching the
existing NVIDIA/AMD behavior. Add a regression test.
Beszel
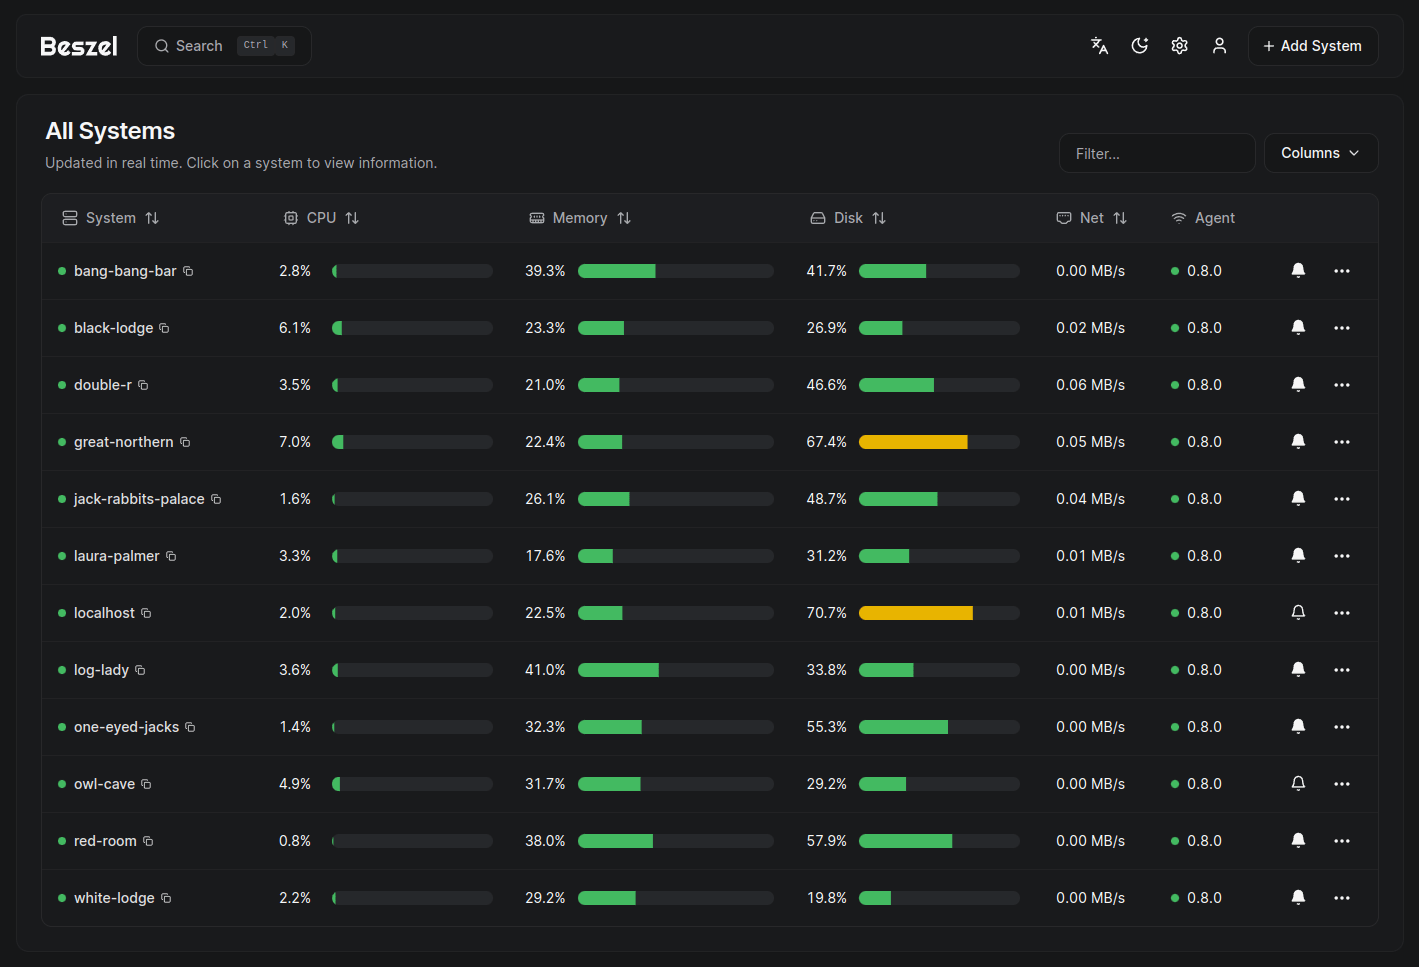
Beszel is a lightweight server monitoring platform that includes Docker statistics, historical data, and alert functions.
It has a friendly web interface, simple configuration, and is ready to use out of the box. It supports automatic backup, multi-user, OAuth authentication, and API access.




Features
- Lightweight: Smaller and less resource-intensive than leading solutions.
- Simple: Easy setup with little manual configuration required.
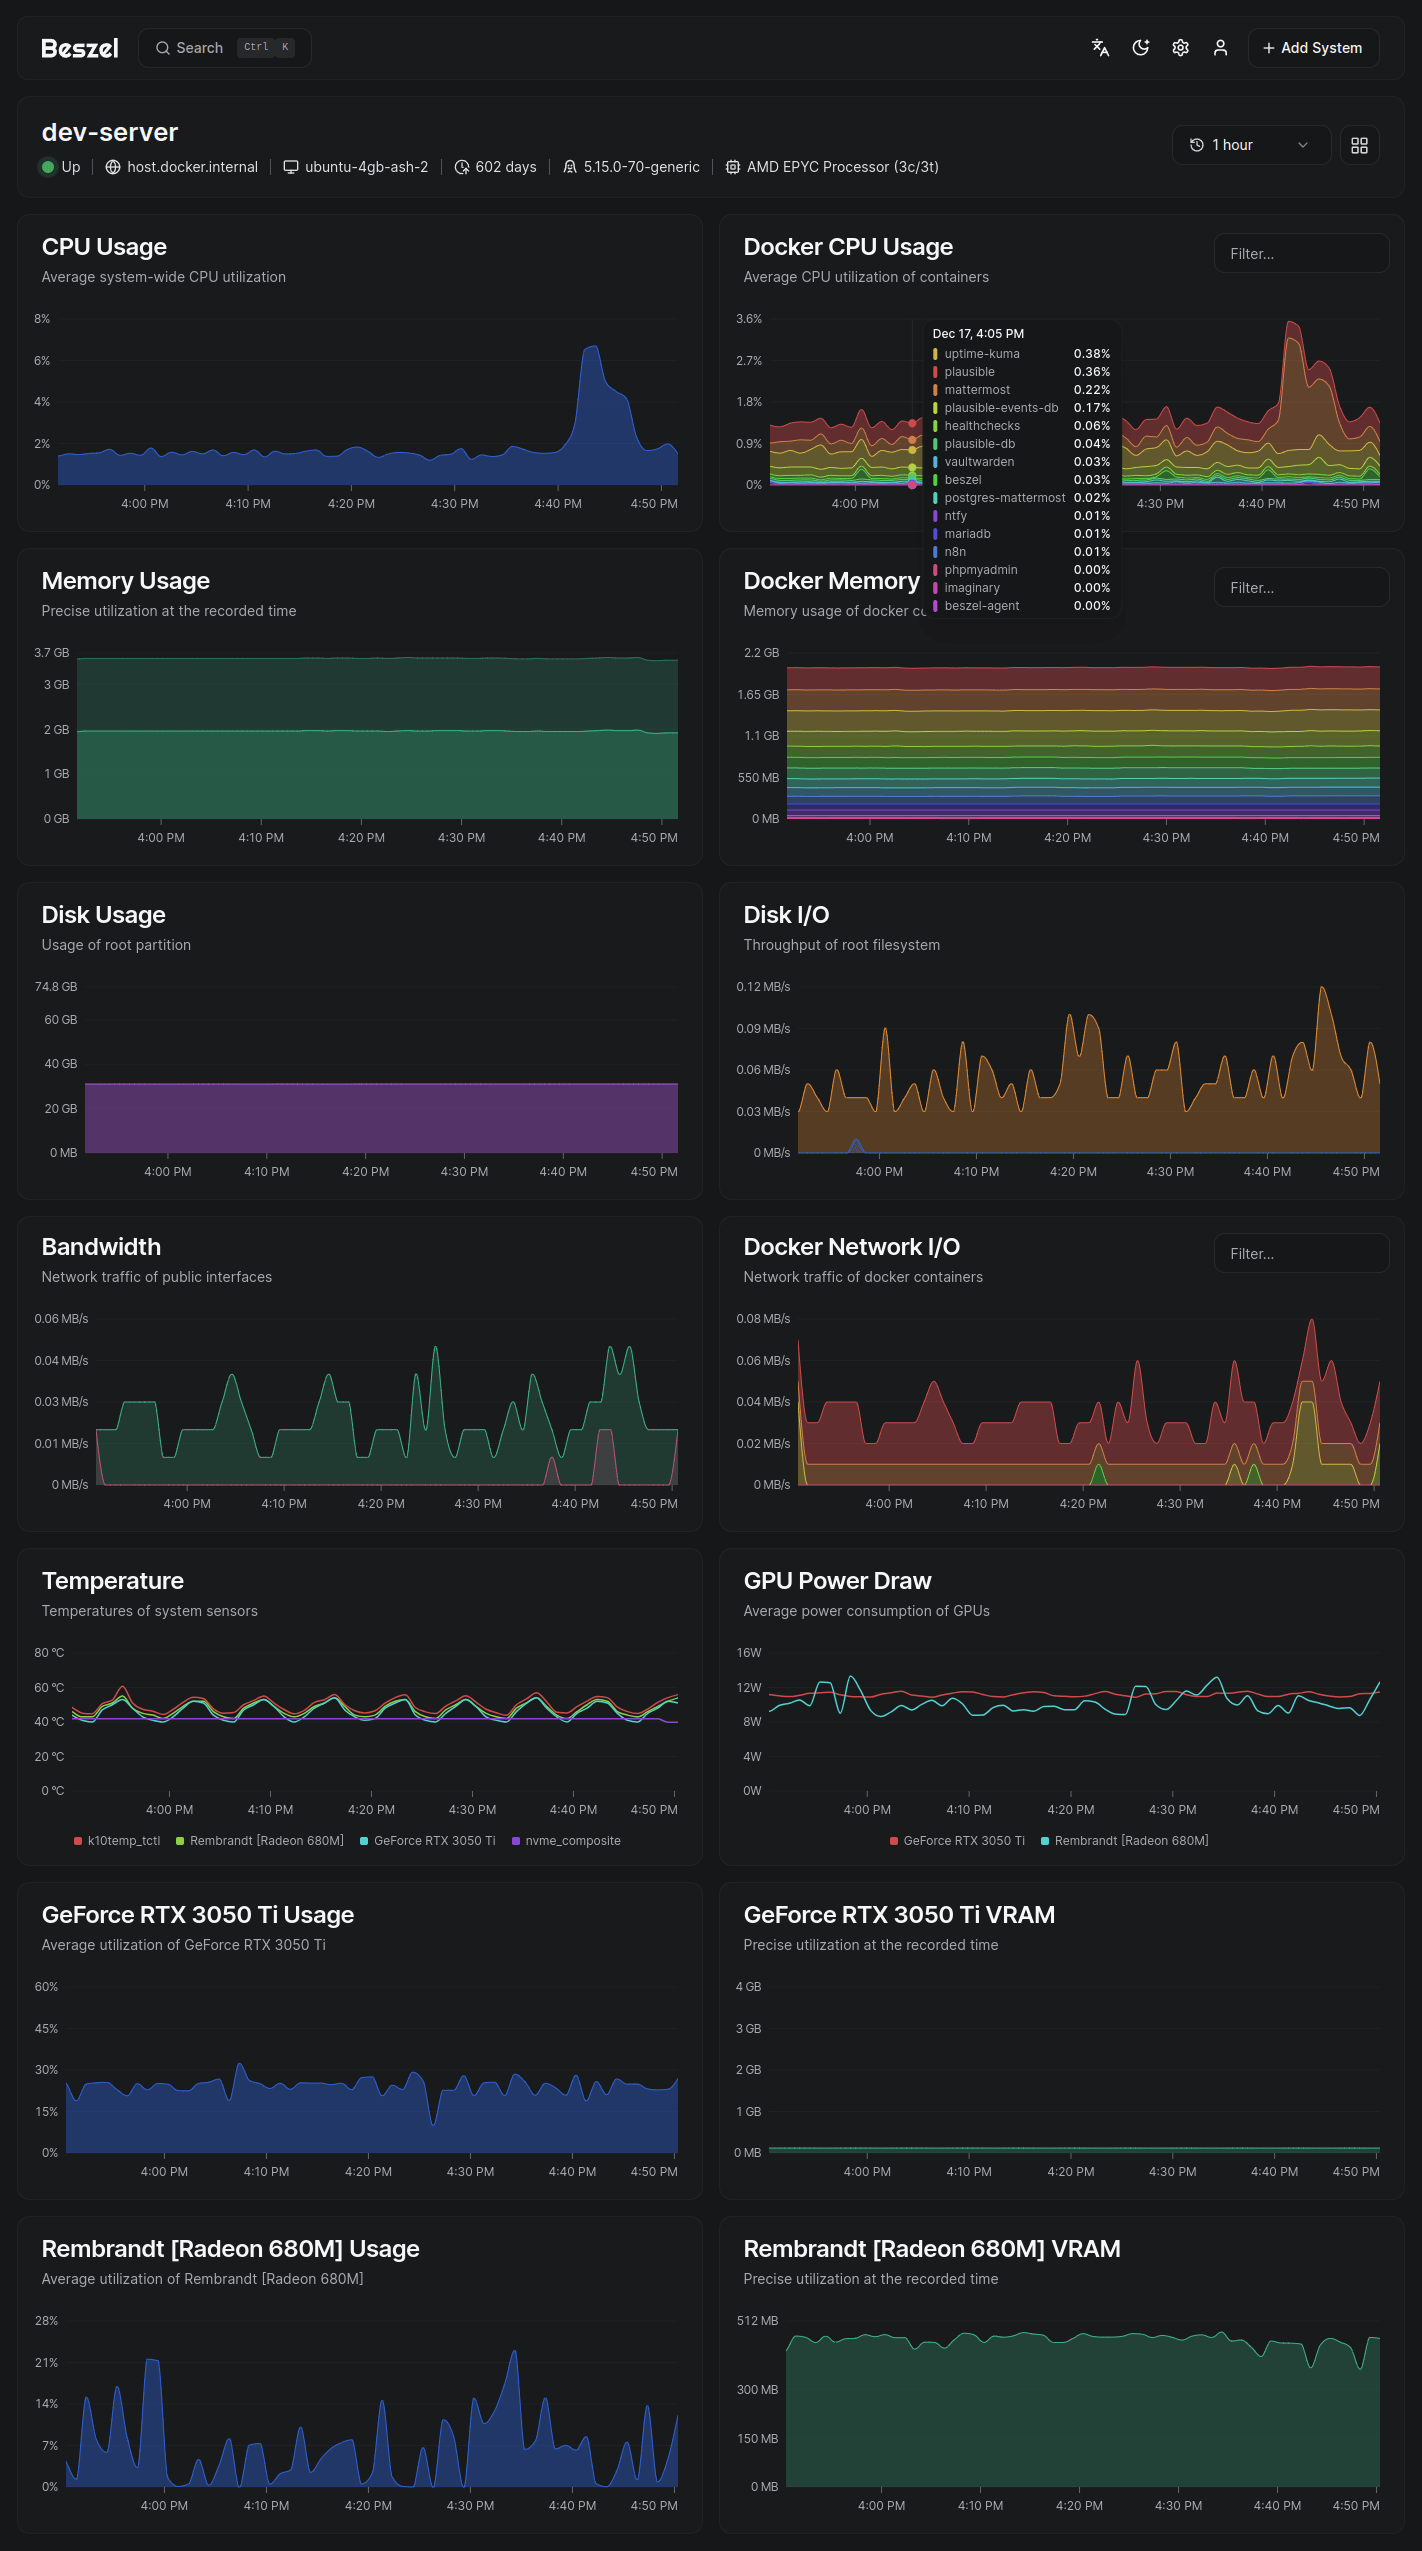
- Docker stats: Tracks CPU, memory, and network usage history for each container.
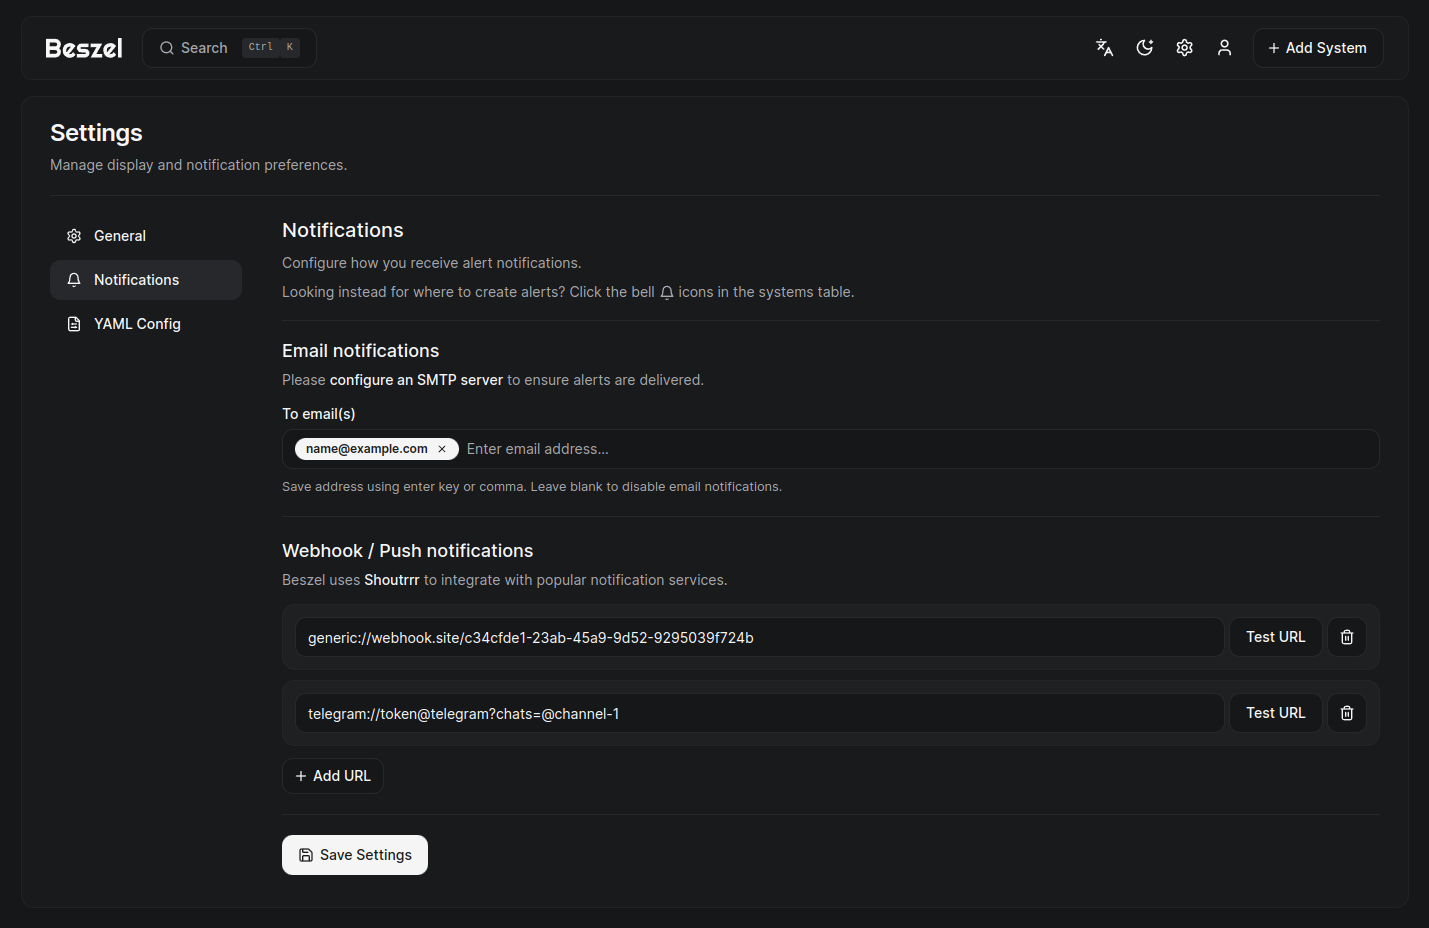
- Alerts: Configurable alerts for CPU, memory, disk, bandwidth, temperature, fan speed, load average, and status.
- Multi-user: Users manage their own systems. Admins can share systems across users.
- OAuth / OIDC: Supports many OAuth2 providers. Password auth can be disabled.
- Automatic backups: Save to and restore from disk or S3-compatible storage.
Architecture
Beszel consists of two main components: the hub and the agent.
- Hub: A web application built on PocketBase that provides a dashboard for viewing and managing connected systems.
- Agent: Runs on each system you want to monitor and communicates system metrics to the hub.
Getting started
The quick start guide and other documentation is available on our website, beszel.dev. You'll be up and running in a few minutes.
Screenshots
Supported metrics
- CPU usage - Host system and Docker / Podman containers.
- Memory usage - Host system and containers. Includes swap and ZFS ARC.
- Disk usage - Host system. Supports multiple partitions and devices.
- Disk I/O - Host system. Supports multiple partitions and devices.
- Network usage - Host system and containers.
- Load average - Host system.
- Temperature - Host system sensors.
- Fan speed - Host system sensors (Linux, via
/sys/class/hwmon). - GPU usage / power draw - Nvidia, AMD, and Intel.
- Battery - Host system battery charge.
- Containers - Status and metrics of all running Docker / Podman containers.
- S.M.A.R.T. - Host system disk health (includes eMMC wear/EOL and Linux mdraid array health via sysfs when available).
Help and discussion
Please search existing issues and discussions before opening a new one. I try my best to respond, but may not always have time to do so.
Bug reports and feature requests
Bug reports and feature requests can be posted on GitHub issues.
Support and general discussion
Support requests and general discussion can be posted on GitHub discussions or the community-run Matrix room: #beszel:matrix.org.
License
Beszel is licensed under the MIT License. See the LICENSE file for more details.