

 98e86b4c9c
CalculateCpuPercentLinux subtracted the stored previous counters from the
current ones without checking direction. When a stats response is processed
after a newer one for the same container, or an accounting counter resets,
the current total reads lower and the unsigned subtraction wraps to ~2^64
instead of going negative.

On the container counter that surfaces as the reported error, and the sample
is discarded along with the container's network stats:

    cpu pct greater than 100: 1.15292150348562e+13

On the system counter it is quieter and worse: the wrapped value inflates the
divisor, so the percentage collapses toward zero and is stored as a healthy
sample rather than rejected. A synthetic rollback measures 2.7e-12 percent.

Both directions are now treated as a new baseline (0% for one sample), which
matches how the function already handles the first-run case.

CalculateCpuPercentWindows had the same unguarded subtraction and is fixed
the same way.

Fixes #2149

Co-authored-by: Ryan Chou <ryanchou1994@users.noreply.github.com>
Beszel
Beszel is a lightweight server monitoring platform that includes Docker statistics, historical data, and alert functions.
It has a friendly web interface, simple configuration, and is ready to use out of the box. It supports automatic backup, multi-user, OAuth authentication, and API access.




Features
- Lightweight: Smaller and less resource-intensive than leading solutions.
- Simple: Easy setup with little manual configuration required.
- Docker stats: Tracks CPU, memory, and network usage history for each container.
- Alerts: Configurable alerts for CPU, memory, disk, bandwidth, temperature, load average, and status.
- Multi-user: Users manage their own systems. Admins can share systems across users.
- OAuth / OIDC: Supports many OAuth2 providers. Password auth can be disabled.
- Automatic backups: Save to and restore from disk or S3-compatible storage.
Architecture
Beszel consists of two main components: the hub and the agent.
- Hub: A web application built on PocketBase that provides a dashboard for viewing and managing connected systems.
- Agent: Runs on each system you want to monitor and communicates system metrics to the hub.
Getting started
The quick start guide and other documentation is available on our website, beszel.dev. You'll be up and running in a few minutes.
Screenshots
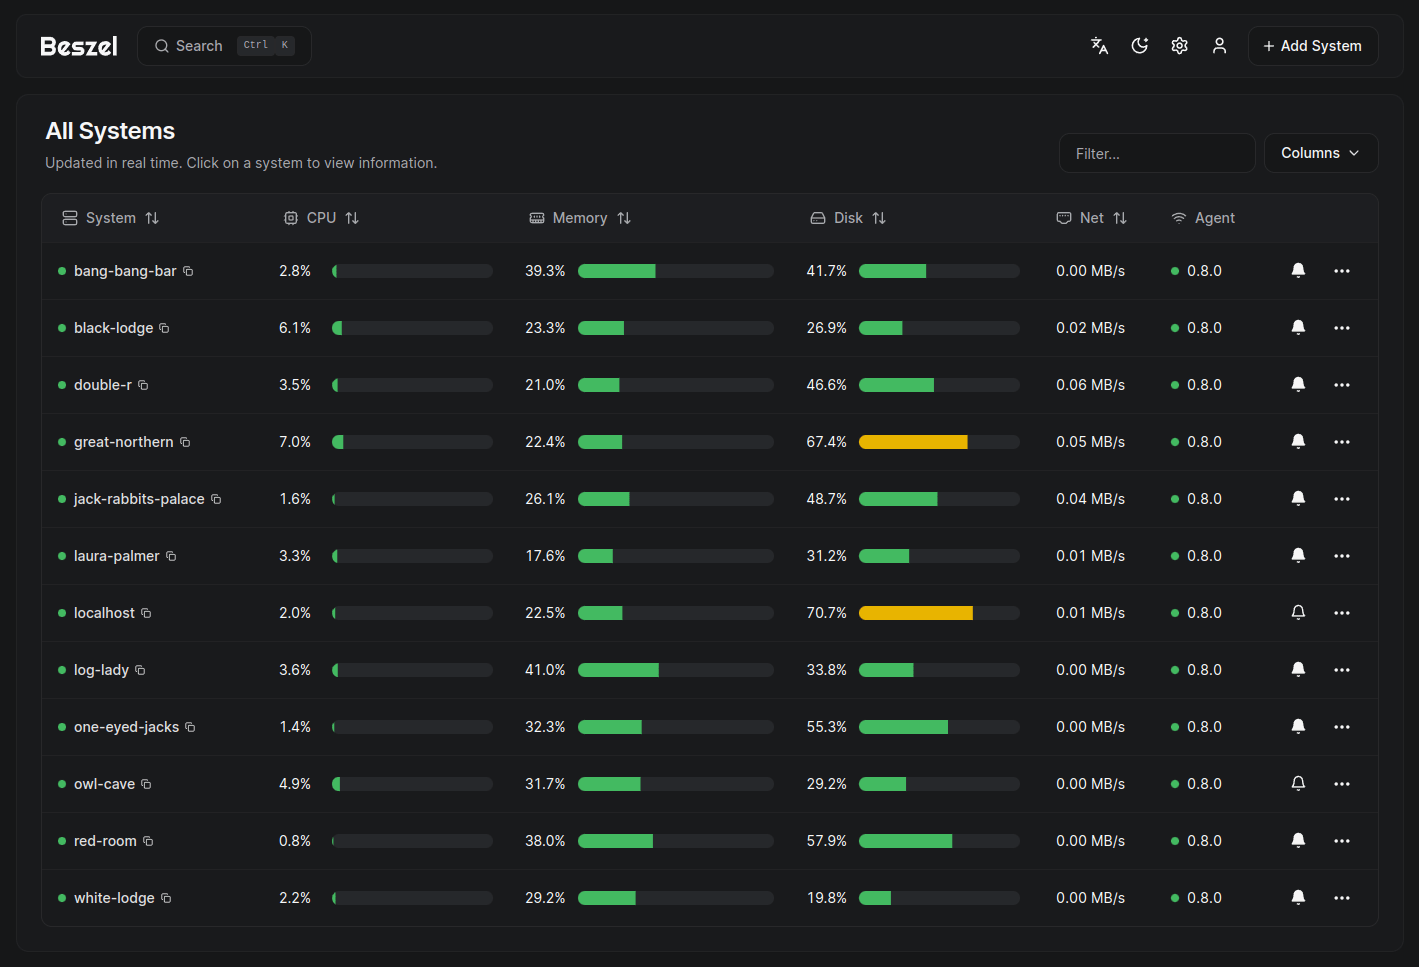
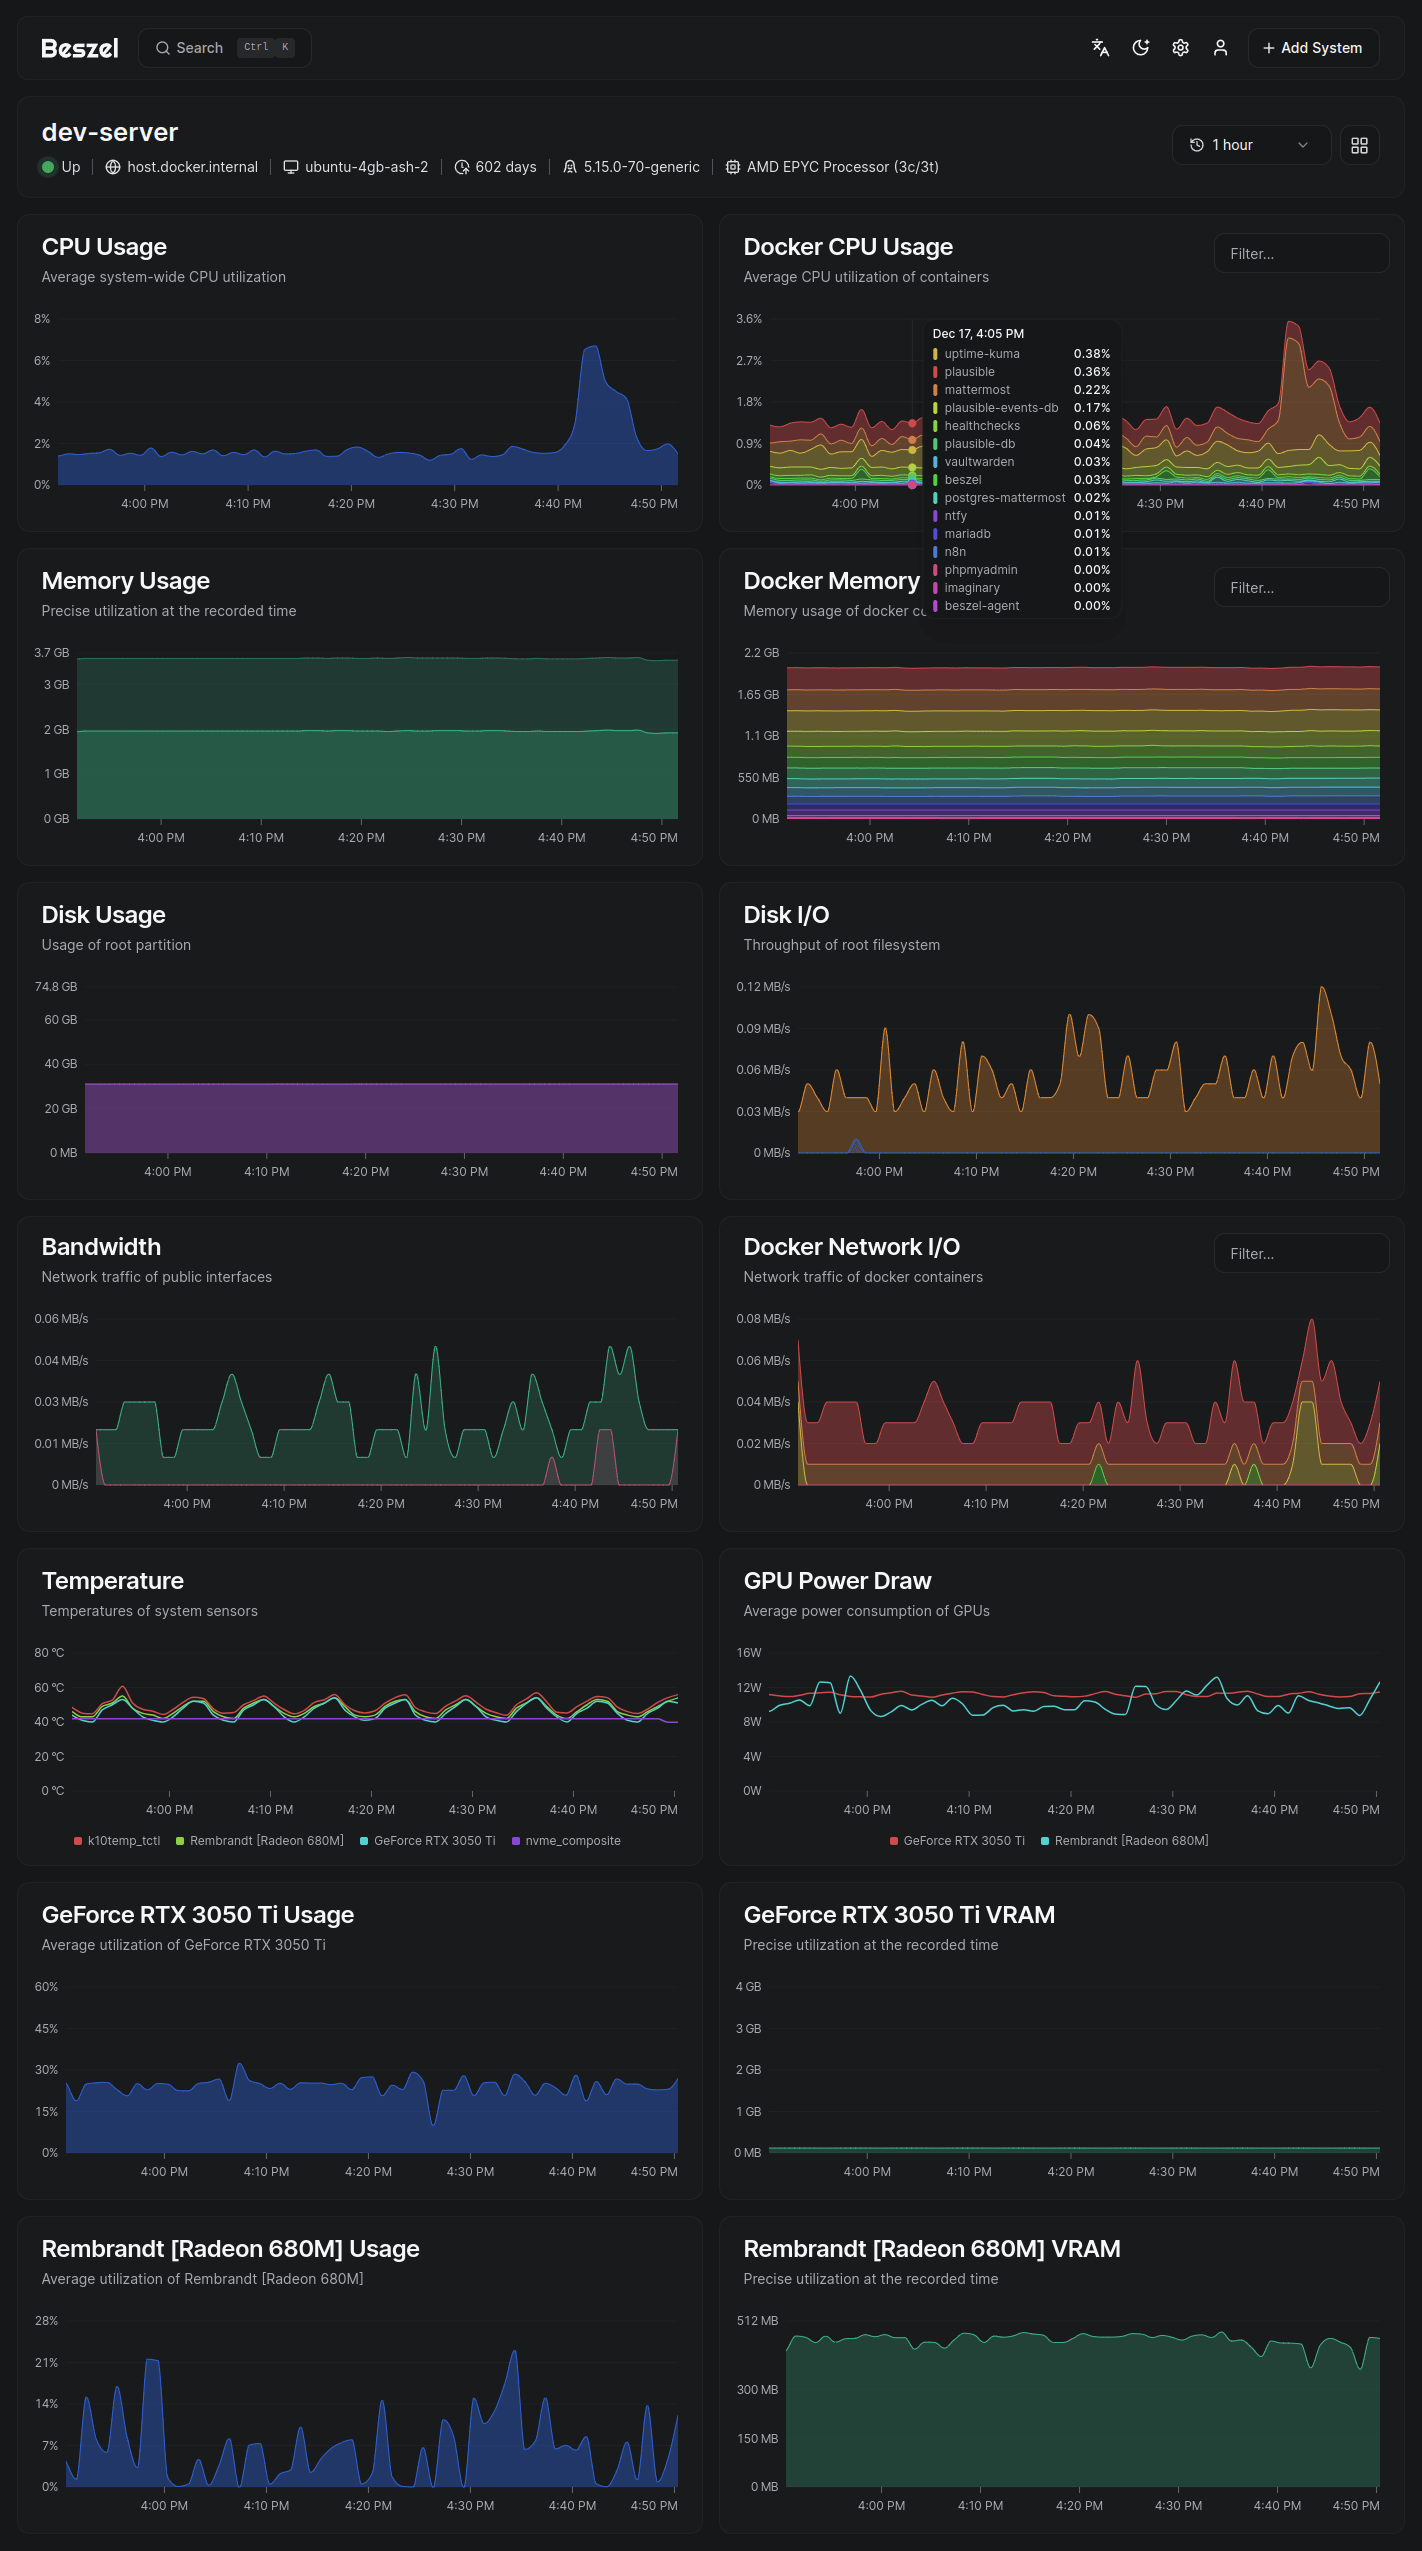
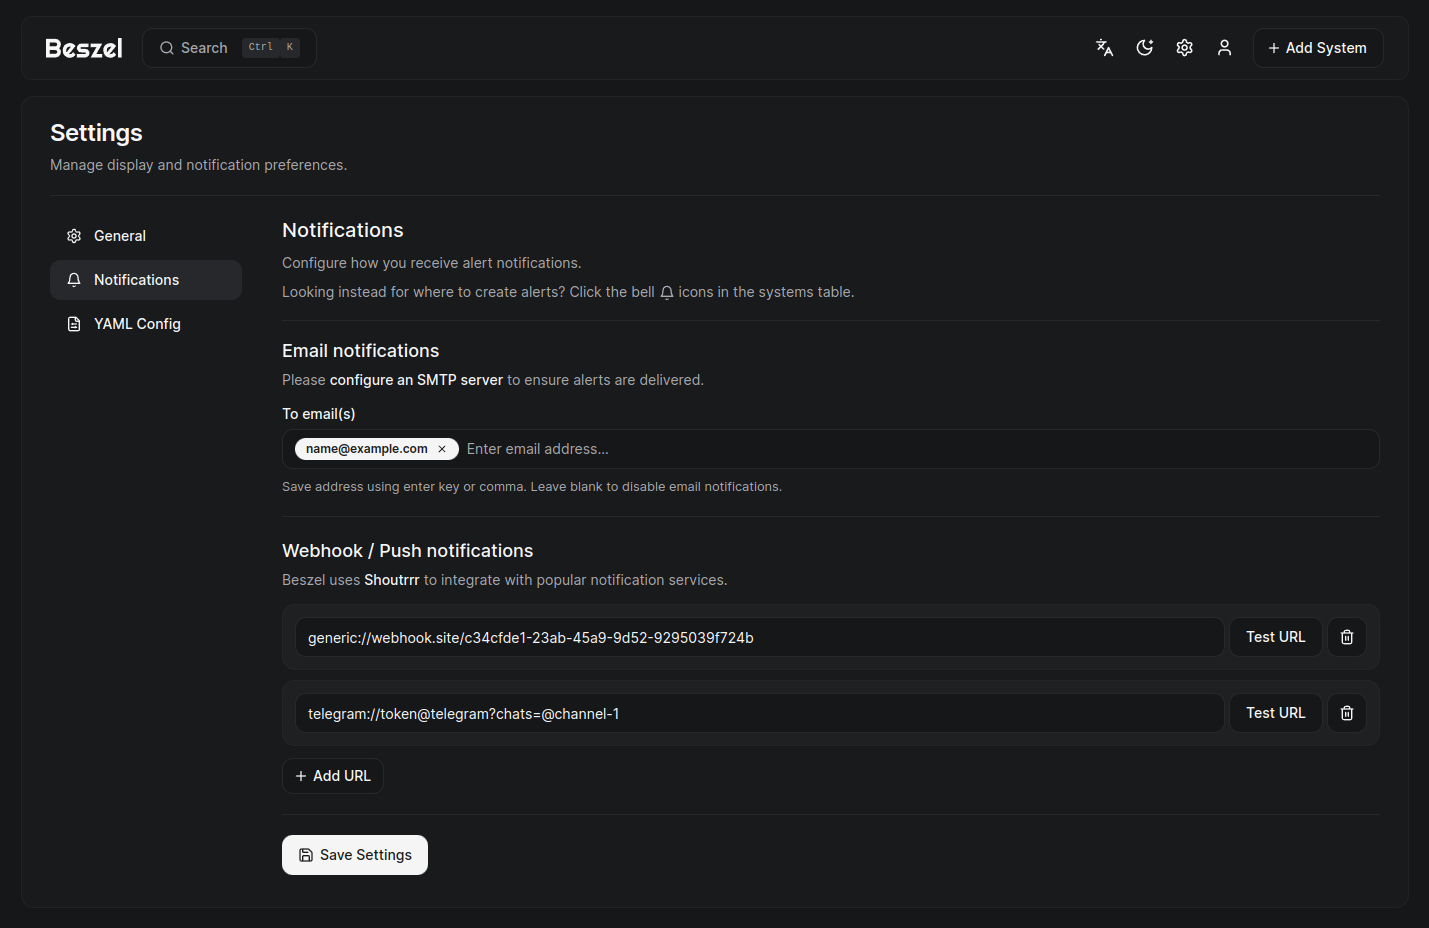
Supported metrics
- CPU usage - Host system and Docker / Podman containers.
- Memory usage - Host system and containers. Includes swap and ZFS ARC.
- Disk usage - Host system. Supports multiple partitions and devices.
- Disk I/O - Host system. Supports multiple partitions and devices.
- Network usage - Host system and containers.
- Load average - Host system.
- Temperature - Host system sensors.
- GPU usage / power draw - Nvidia, AMD, and Intel.
- Battery - Host system battery charge.
- Containers - Status and metrics of all running Docker / Podman containers.
- S.M.A.R.T. - Host system disk health (includes eMMC wear/EOL and Linux mdraid array health via sysfs when available).
Help and discussion
Please search existing issues and discussions before opening a new one. I try my best to respond, but may not always have time to do so.
Bug reports and feature requests
Bug reports and feature requests can be posted on GitHub issues.
Support and general discussion
Support requests and general discussion can be posted on GitHub discussions or the community-run Matrix room: #beszel:matrix.org.
License
Beszel is licensed under the MIT License. See the LICENSE file for more details.